


The 19 million missing voter myth
Why there aren’t a population of untapped ex-Biden voters out there to be reached

Right after the election, I wrote about how the “14 million Democrats stayed home” narrative was wrong and also annoying, as a part of a greater piece hoping to combat the turnout narrative in the early days. The 14 million number was mostly, I think, coming from lazy comparisons of 2024 votes cast to 2020 votes cast before all votes were actually counted (notably, while the slow and Democratic state of CA was still working on it). People seem to have dropped it now that the vote totals on NYT and elsewhere reflect the actual numbers, and now that it’s clear that aggregate turnout wasn’t dramatically down from 2020.
Now, this narrative seems to have switched over from 14 to 19 million and from raw vote total differences between Biden and Harris to slightly more complicated math. A quick scan of twitter turns up a pile of references to “19 million democrats”, ranging from cope, frustration, and even some conspiracy theorizing (“what if those voters never existed at all???”). This number comes from a real-er place than the 14 million, but I still think it’s wrong. I’m going to go through the math and why I don’t think “19 million Democrats stayed home” is correct or useful, but first we have to talk a little more about what turnout is. If you want the quick explanation, scroll to “That Pesky 19 Million Number” and “On Churn”, but I really hope you’ll humor me to talk more about turnout first.
Turnout 201
Per UF Election Lab, there were 156,336,693 ballots counted in the 2024 election, and 159,738,337 in 2020. This is similar but not identical to presidential votes, since UFL measures all ballots cast and counted rather than votes for a particular office. In theory, this number could be a little higher than presidential votes if some people left that part of the ballot blank. I would describe that 2024 turnout as basically in line with 2020, based on simply looking at the 3 millionish shift compared to the total voting population. That’s a vibes analysis, admittedly. If you want to be more analytical, the thing to do is normalize that turnout to Voting Eligible Population (i.e. the people in the US who would be allowed to vote if they registered and turned up) so that you’re accounting for population growth. If you do that, also per UF Election Lab, you get 63.9% VEP turnout in 2024, and 66.36% VEP turnout in 2020. 2016 was at 60.12% VEP, so we’re still talking about quite a high number even though it’s lower than 2020.
Is 63.9% vs 66.36% a big difference? Imo, not particularly, especially given the high emotional stakes of 2020 combined with an unprecedented surge in efforts to get people to vote by mail. I am more likely to attribute that drop to an inability to ever re-reach the heights of 2020. I will absolutely allow that it is some relative drop in turnout and that probably indicates something about the perceived stakes of the election or motivation or whatever your pet peeve is.
The place people run into trouble is that *aggregate* national turnout doesn’t tell you much of anything about what happened in the individual states and districts that we actually care about. It can obscure a lot of difference between states that all comes out in the wash of the big aggregate number.
Anyway here’s change in VEP adjusted turnout from 2020 by state (also grabbed from UF Election Lab). A negative here means turnout as percent of VEP dropped (i.e. lower turnout adjusting for population growth), a positive means it rose.
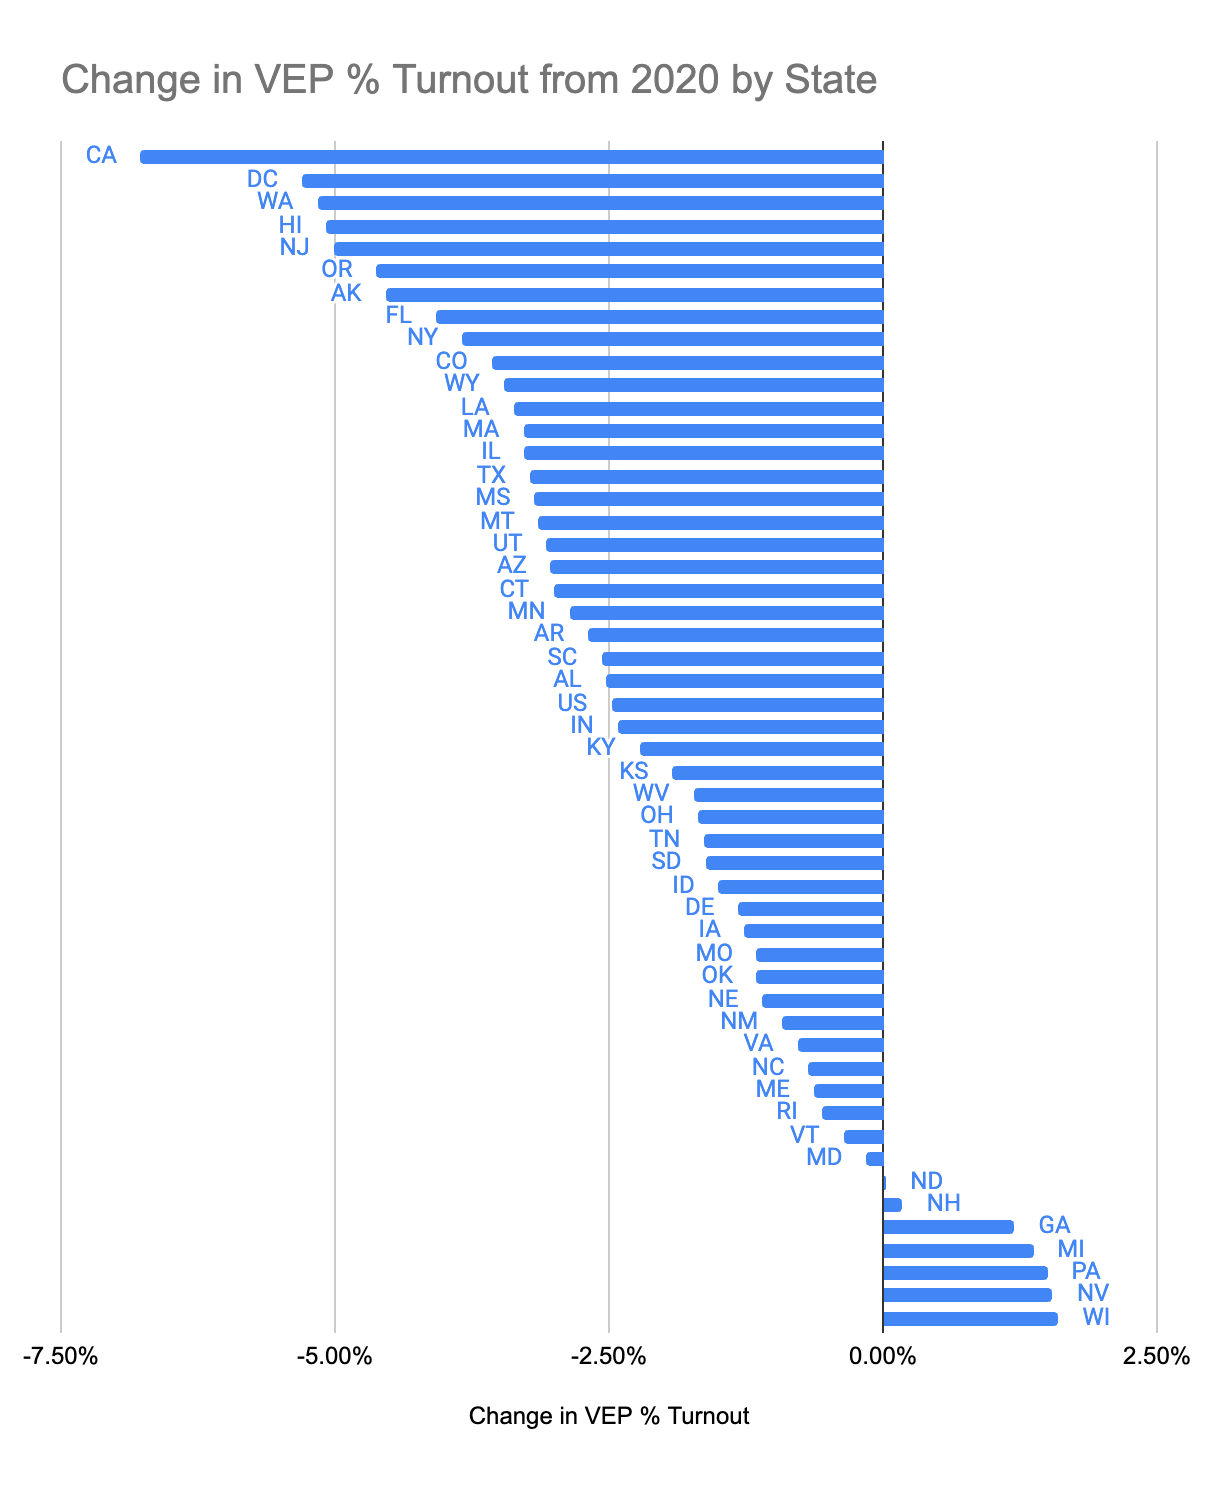
You might notice that most of the swing states have positive turnout as percent VEP growth! You might also notice that CA looks extremely bad here, followed by a few of its fellow deep blue states. As I’ve noted before, the deep blue states did seem to have a “turnout problem” this year! Something is clearly up there. It’s just not present in states that were meaningfully responsible for Trump’s victory, since we do not have a national popular vote system.
Turnout is a fascinating topic on its own merits, but usually when it comes up on twitter, people are looking for causality. You’re looking for an explanation of why vote share changed the way it did. Turnout in 2024 does a pretty lousy job at explaining that changed vote share. Plus, if turnout is *up* in swing states that we still lost...what do you do with that?
Aggregate Turnout Is Confusing
The normal next step is to start arguing that while *aggregate* turnout was up in swing states, *Harris* got fewer votes and therefore Democrats stayed home. It’s just that other new Republicans showed up out of the woodwork to vote.
There’s two main problems with this.
It assumes that “Republicans” and “Democrats” are separate types of person entirely who cannot swap
It assumes that showing up to vote and who you vote for have nothing to do with each other
On (1)- aggregate votes per candidate doesn’t tell you a thing about if people are switching between candidates, voting the same every time, etc. You could hypothetically have 100 votes for A and 100 votes for B and then next election get the same 100-100 result, and have those 100 A votes and 100 B votes come from opposite groups. Or 50 people each could have shifted from A to B and vice versa. You just don’t know!
This is important because when you are trying to interpret “Harris got less votes than Biden”, it’s tempting to believe that all those people who voted for Biden still exist as Democratic votes out in the world, just waiting to vote for Harris. In actuality, you don’t know the composition of those Biden and Harris votes and if they’re similar, different, etc. Even once you have voter file data, that just tells you who voted, not how they voted, and it requires fairly difficult analysis to back out useful conclusions about how different groups voted (Catalist does this in their What Happened report which is not yet out for 2024).
On (2)- Failure to vote can be an expression of frustration with the political system as a whole, distaste for your usual party’s candidate, feeling that the election doesn’t have real stakes, or a dislike of your usual party’s candidate but unwillingness to go all the way to voting for the opposite party. Or you could just have been really busy that day, or sick, or at work, etc. “How you voted last time” is a good predictor of your vote this time, but not a perfect one.
Counterfactual Voting
Even if you know who showed up and can make an educated guess about who they voted for (so, post-voterfile and post-Catalist-like-analysis), the counterfactual of how all the nonvoters *would* have voted had you marched them to the polls remains complicated and difficult. Let’s say after everything is done, we’re pretty sure that a million people in some state voted for Biden and then didn’t vote at all in 2024. Short of asking them individually, we don’t know exactly why they didn’t vote, or who they would have picked.
Nate Cohn has done some analysis which suggests that higher turnout in 2024 would have actually hurt Democrats, as the sort of voter who stayed home leaned Republican.
“…the low turnout among traditionally Democratic-leaning groups — especially nonwhite voters — was a reflection of lower support for Ms. Harris: Millions of Democrats soured on their party and stayed home, reluctantly came back to Ms. Harris or even made the leap to Mr. Trump. And if those who stayed home had voted, it wouldn’t have been an enormous help to Ms. Harris, based on Times/Siena polling linked to validated records of who did or didn’t vote.”
This scans with what we were seeing in pre-election polling, that the sporadic voters usually targeted by aggressive Democratic GOTV programs were increasingly just Republicans. It’s a pretty rough shift for turnout-happy Democrats!
That Pesky 19 Million Number
I’m honestly not sure who exactly originated that 19 million number, or the 14 million one that preceded it. The explanation that I can actually find comes from Mike Podhorzer and his Weekend Reading blog. If someone else has derived 19 million in a different way (that uses math and isn’t pure twitter vibes), happy to also address whatever they did if you point me to it.
Podhorzer says:
“This year, based on VoteCast data (see chart in the previous section), we can estimate that about 19 million people who voted for Biden four years ago stayed home. (40 percent of those voting in 2024 had voted for Biden in 2020, and 40 percent had voted for Trump. From there, it’s simple arithmetic.)” [emphasis his]
For maximum fairness, we’re going to walk through the math and the logic he lays out, so you can understand exactly what he’s referring to and why I don’t think it’s useful.
Here’s the 2024 VoteCast question that’s feeding this:

And here’s a walkthrough of his math:

The AP VoteCast thinks that 40% of Harris voters in 2024 had voted in 2020, which means that about 62 million Harris voters had voted in 2020. If you subtract that from the total Biden votes, you get 19 million Biden voters who didn’t show up for Harris.
My first problem with this logic is that running the exact same thing for Trump voters, you get 12 million “couch sitters” who apparently sat out voting for the same exact candidate in a year he increased both his raw votes and his vote share. On the face of it, the existence of this “gap” doesn’t mean much if it’s roughly the same proportion of 2020 voters for each candidate. [It’s also entirely possible that the VoteCast numbers here are wrong, and I am notoriously skeptical of exit polls, but since I can’t provide a better estimate I am going with this one]
My second problem is that, as explained above, there’s no reason to believe that these people are all Democrats or would have all voted for Harris if dragged to the polls. Instead, there are good reasons to believe that nonvoters in 2024 are disproportionately Republican, and that drops in turnout among groups like Hispanic voters are representative of a move away from Democrats rather than a particular GOTV failure this year.
On Churn
If you’ve never stared at election data before, you might be surprised that so many Biden voters didn’t vote in 2024, and that so many new voters for each candidate showed up. Stats about voters and turnout can make it feel like “voters” are a static group that changes a little around the edges, as we obsess about small % shifts in turnout or vote share.
In reality, all this stability masks fairly large turnover in the electorate year over year. It’s kind of incredible that vote share and turnout are as flat as they are! Per AP VoteCast, in 2020, around 39% of Biden voters had voted in 2016. That’s less than half! Estimates of this churn vary between sources, and it’s tricky to nail down because it is partially a result of people moving, registering, dying, and other activities that alter the voter file.
People moving in and out of voting, and on and off the voter file, is *normal*. Catalist estimates that 14% of voters in 2020 were first time voters and an additional 15% were new to the file because of voting in a different state than in 2016.

Voters aren’t static, and looking at figures like the math laid out above without keeping ordinary churn in mind can have you obsessing over “missing” voters who really aren’t missing at all.
Analysis Leads Strategy
Honestly, if it was just that people were running around quoting a number I find incorrect and not useful, I would be annoyed online but probably not write a whole post about it. The reason I’ve bothered to do this is that wrong analysis leads you to develop wrong strategies, which I care deeply about in a moment where Democrats are struggling. I’m coming down so hard on this 19 million number because I think it’s being used to prop up an incorrect set of explanations for the election and consequently some really incorrect strategic decisions. The explicit thesis of the Podhorzer piece is that “The popular vote result was almost entirely a collapse in support for Harris and Democrats, not an increase in support for Trump and MAGA.” or “a vote of no confidence in Democrats, not an embrace of Trump or MAGA.”
If you are led to believe that the reason Trump won was the disengagement of a bunch of consistent Democrats, as the 19 million logic might lead you, you’re going to double down on things like GOTV programs and base engagement. You’re going to ignore the very real losses Democrats suffered among previously-consistent Democratic communities like Hispanic voters. You’re not going to look at what might have attracted previously-Democratic voters to Trump. And you’re going to keep losing.
This election was not a problem of Democratic unenthusiasm. Turnout was up in swing states, and Harris won more votes than Biden in key swing states. It’s just that Trump improved *even more*. At some point, you have to confront that voters did see something appealing about Trump (or at least, something sufficiently un-appealing about Democrats) and try to figure out what that was.
Saying “we’d win if only more people voted for Democrats” is a tautology. Of course we would! Doubling down on GOTV programs among sporadic voters who we know are becoming more Republican is not going to accomplish that. At some point, we have to try to convince voters that Democrats are good and offer something valuable, and we have to address the fact that the Democratic party is increasingly out of step with voters. We’ve also got to address the fact that our coalition is changing, as we lose ground with voters of color and non-college voters. Trying to revive the old coalition isn’t going to work, and yearning for the voters who put Biden in office isn’t going to help us.
Addendum: Here’s that same “gap” math for 2016→ 2020 voters. Trump got more votes in 2020 than in 2016, despite losing, because of the wildly high 2020 turnout.

Second addendum: If you’re like wow my Democratic/progressive organization would LOVE to hear more about this to inform our work, message me, explaining this sort of thing is one of my favorite types of consulting work. charlotte (at) cauldron (dot) llc.