
Primary and General Electorates Are Very Different
A not so gentle reminder as we move into general election season

We are so, so close to being free of 2026 primary season. I strongly prefer general elections, because the thing I care most about is beating Republicans. And I hate the infighting.
As we collectively try to refocus on winning in November, I figured it might be helpful to have a quick reminder that a primary and a general are *very different elections*. They have different electorates, different incentives, and operate in a different ideological space. Doing well in a primary does not necessarily mean you will do well in a general, and vice versa.
The two ways to think about these changing electorates are as a set of demographics, or as a set of policy preferences. The first will tell you that primary voters are older, more ideological, more educated, and tend to be more white, although this all varies slightly by geography. This is fine, but I don’t find it that useful for building a mental model of the differences. The second I find more useful.
Courtesy of the Broockman and Kalla paper (“Should Moving to the Middle Win Candidates Votes? It Depends Where Voters Are”, which laid out voter preferences across a range of issues, as well as estimating the impact of changing candidate positions on each of those issues) we have some pretty dang nice charts of these differing electorates. This gives us an ability to compare *policy* preferences in a way that’s quite hard when working across multiple surveys. All these figures can be found in their preprint, linked above, as can the full text of each position on each issue (in the appendix).
This survey was performed on voter-file-matched registered voters, weighted to the 2024 electorate. Democratic and Republican primary voters are then broken out from that population. Not an exact match for every primary, but pretty good. And the survey is huge, too (n=6k) which gives you enough power to get a good look at these subgroups. They asked voters to select from three positions on each issue, the liberal one, the elite middle one, and the conservative one. Full positions can be found in their paper, but here’s an example:
This is designed to feed into the conjoint that’s the main point of the paper (you should REALLY read it, it’s good), but it also makes a nice comparison tool because you can pin down what specific positions these voters are accepting or rejecting.
Here are your Democratic primary voters. (sorry, it’s a screenshot)
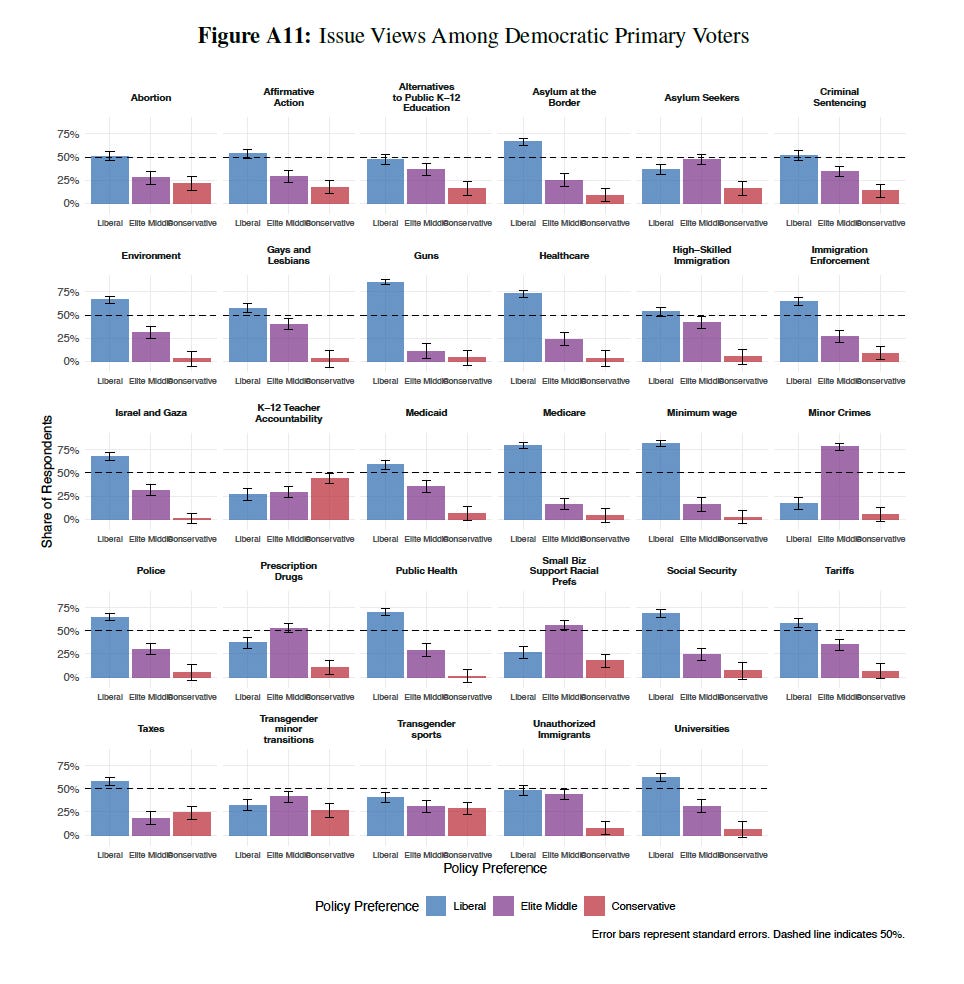
Democratic primary voters are as you’d expect, *quite* liberal. 84%1 take the liberal position on guns, 81% on minimum wage.
Here are your Republican primary voters. They’re a mirror image- very conservative on most issues.2
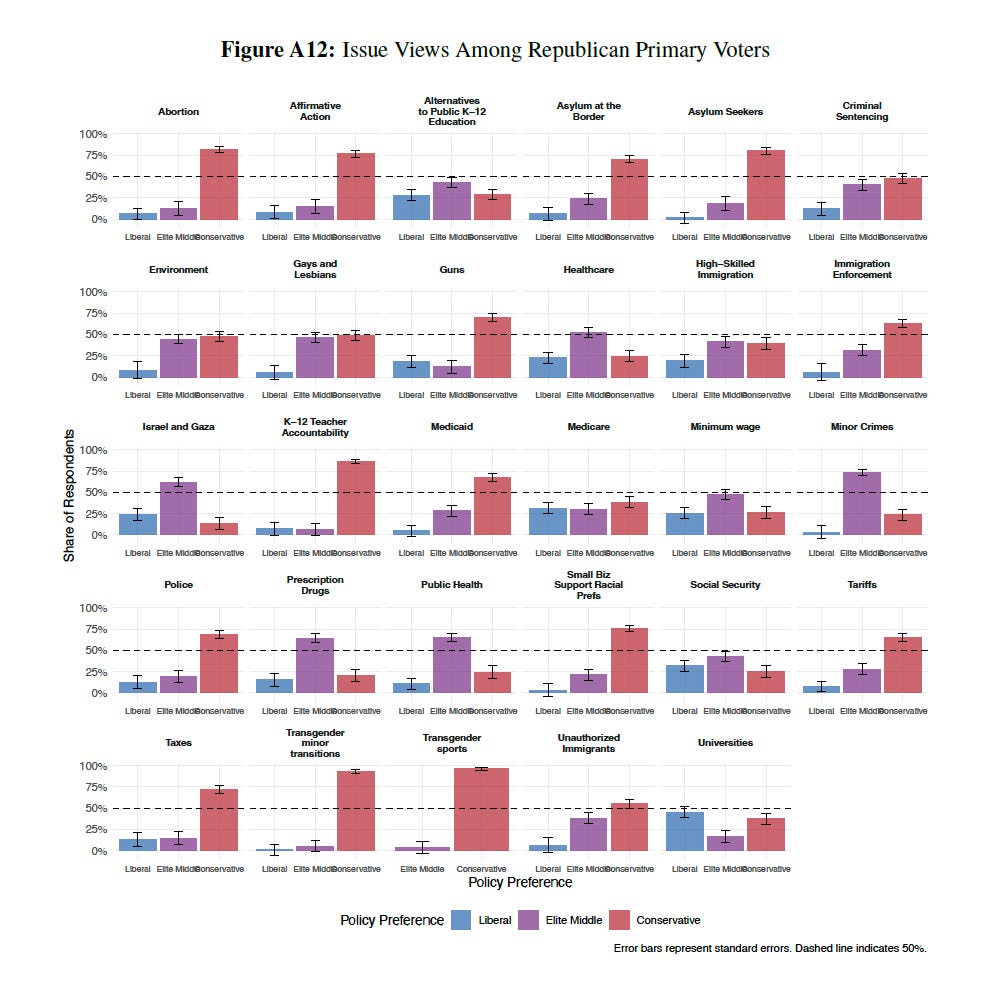
And HERE are the general election voters. This group contains the two groups above, plus more people who didn’t vote in a primary but would show up on election day.
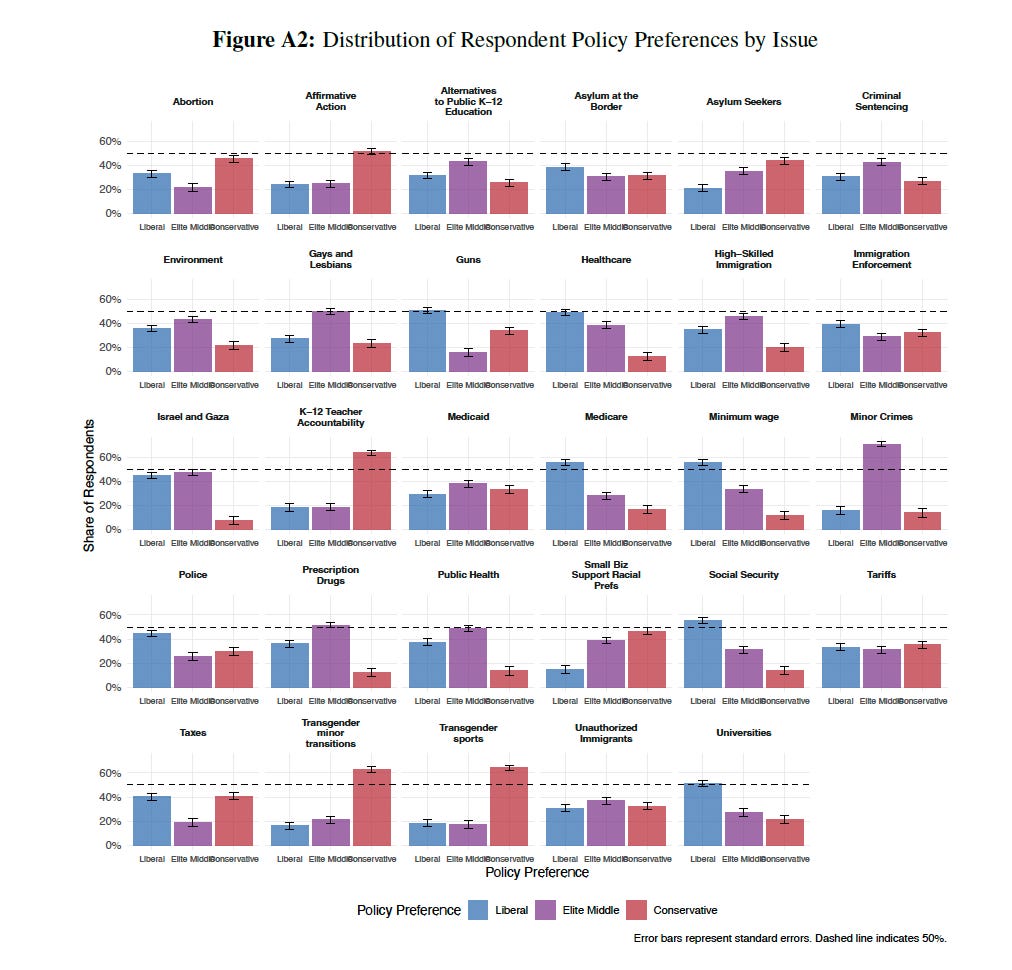
Squinting at all these charts to do a comparison is a bit tricky, so I had Claude transcribe the numbers (approximately) and made this one, comparing the share selecting the liberal position from each section of the electorate. Note this obscures change from the middle to conservative, etc, but it was the only way to make the chart readable.
Unsurprisingly, the general electorate is far less liberal than the Democratic primary electorate on most issues. This is a little bit definitional - Democratic primaries contain *Democrats* (although some primaries are open, etc), who tend to hold Democratic positions, and therefore liberal positions. But it’s good to keep in mind when trying to make the mental pivot.
Here’s an additional chart of the gaps between the Dem primary electorate and general electorate (on % selecting the liberal position) by issue.
As we move towards November, remember: the general election is a different beast. General election voters are not the same as primary election voters. And beating Republicans is what matters.
Methods note: I had Claude estimate these numbers from the charts in the paper since there isn’t attached data until the paper is formally published. It is currently a pre-print. Take these numbers as approximations.
The places where Republicans and Democrats diverge from expectations are really the most interesting!
I wrote a piece on this! Proportional representation would raise turnout and end bitter primary fights by moving the primary into a ranked general.
https://substack.com/home/post/p-210101146
I love the chart thank you. I think there may be a mistake re: Medicaid b/c Kalla classifies Medicaid as an issue where candidates who moderate would be penalized. (Not sure what exactly Kalla was measuring -- Medicaid expansion?)